 Global Issues
Poverty Facts and Stats
Author and Page information
This print version has been auto-generated from https://www.globalissues.org/article/26/poverty-facts-and-stats
Almost half the world — over three billion people — live on less than $2.50 a day.
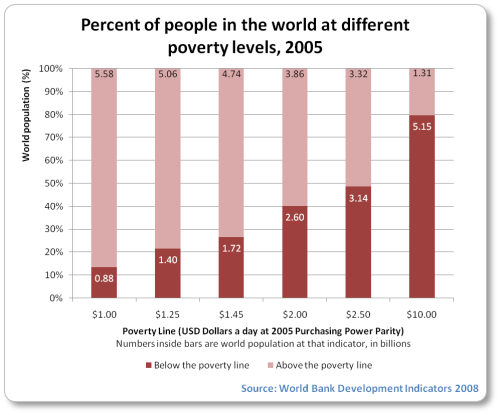
At least 80% of humanity lives on less than $10 a day.Source 1
More than 80 percent of the world’s population lives in countries where income differentials are widening.Source 2
The poorest 40 percent of the world’s population accounts for 5 percent of global income. The richest 20 percent accounts for three-quarters of world income.Source 3
According to UNICEF, 22,000 children die each day due to poverty. And they
die quietly in some of the poorest villages on earth, far removed from the scrutiny and the conscience of the world. Being meek and weak in life makes these dying multitudes even more invisible in death.
Source 4Around 27-28 percent of all children in developing countries are estimated to be underweight or stunted. The two regions that account for the bulk of the deficit are South Asia and sub-Saharan Africa.
If current trends continue, the Millennium Development Goals target of halving the proportion of underweight children will be missed by 30 million children, largely because of slow progress in Southern Asia and sub-Saharan Africa.Source 5
Based on enrollment data, about 72 million children of primary school age in the developing world were not in school in 2005; 57 per cent of them were girls. And these are regarded as optimistic numbers.Source 6
Nearly a billion people entered the 21st century unable to read a book or sign their names.Source 7
Less than one per cent of what the world spent every year on weapons was needed to put every child into school by the year 2000 and yet it didn’t happen.Source 8
Infectious diseases continue to blight the lives of the poor across the world. An estimated 40 million people are living with HIV/AIDS, with 3 million deaths in 2004. Every year there are 350–500 million cases of malaria, with 1 million fatalities: Africa accounts for 90 percent of malarial deaths and African children account for over 80 percent of malaria victims worldwide.Source 9
Water problems affect half of humanity:
- Some 1.1 billion people in developing countries have inadequate access to water, and 2.6 billion lack basic sanitation.
- Almost two in three people lacking access to clean water survive on less than $2 a day, with one in three living on less than $1 a day.
- More than 660 million people without sanitation live on less than $2 a day, and more than 385 million on less than $1 a day.
- Access to piped water into the household averages about 85% for the wealthiest 20% of the population, compared with 25% for the poorest 20%.
- 1.8 billion people who have access to a water source within 1 kilometre, but not in their house or yard, consume around 20 litres per day. In the United Kingdom the average person uses more than 50 litres of water a day flushing toilets (where average daily water usage is about 150 liters a day. The highest average water use in the world is in the US, at 600 liters day.)
- Some 1.8 million child deaths each year as a result of diarrhoea
- The loss of 443 million school days each year from water-related illness.
- Close to half of all people in developing countries suffering at any given time from a health problem caused by water and sanitation deficits.
- Millions of women spending several hours a day collecting water.
- To these human costs can be added the massive economic waste associated with the water and sanitation deficit.… The costs associated with health spending, productivity losses and labour diversions … are greatest in some of the poorest countries. Sub-Saharan Africa loses about 5% of GDP, or some $28.4 billion annually, a figure that exceeds total aid flows and debt relief to the region in 2003.Source 10
- Number of children in the world
- 2.2 billion
- Number in poverty
- 1 billion (every second child)
- Shelter, safe water and health
For the 1.9 billion children from the developing world, there are:
- 640 million without adequate shelter (1 in 3)
- 400 million with no access to safe water (1 in 5)
- 270 million with no access to health services (1 in 7)
- Children out of education worldwide
- 121 million
- Survival for children
Worldwide,
- 10.6 million died in 2003 before they reached the age of 5 (same as children population in France, Germany, Greece and Italy)
- 1.4 million die each year from lack of access to safe drinking water and adequate sanitation
- Health of children
Worldwide,
- 2.2 million children die each year because they are not immunized
- 15 million children orphaned due to HIV/AIDS (similar to the total children population in Germany or United Kingdom)
Rural areas account for three in every four people living on less than US$1 a day and a similar share of the world population suffering from malnutrition. However, urbanization is not synonymous with human progress. Urban slum growth is outpacing urban growth by a wide margin.Source 12
Approximately half the world’s population now live in cities and towns. In 2005, one out of three urban dwellers (approximately 1 billion people) was living in slum conditions.Source 13
In developing countries some 2.5 billion people are forced to rely on biomass—fuelwood, charcoal and animal dung—to meet their energy needs for cooking. In sub-Saharan Africa, over 80 percent of the population depends on traditional biomass for cooking, as do over half of the populations of India and China.Source 14
Indoor air pollution resulting from the use of solid fuels [by poorer segments of society] is a major killer. It claims the lives of 1.5 million people each year, more than half of them below the age of five: that is 4000 deaths a day. To put this number in context, it exceeds total deaths from malaria and rivals the number of deaths from tuberculosis.Source 15
In 2005, the wealthiest 20% of the world accounted for 76.6% of total private consumption. The poorest fifth just 1.5%:
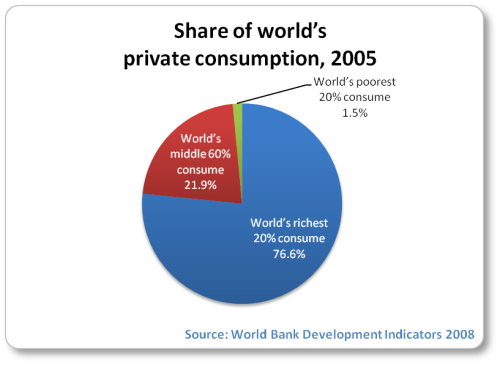
The poorest 10% accounted for just 0.5% and the wealthiest 10% accounted for 59% of all the consumption:

1.6 billion people — a quarter of humanity — live without electricity:
Breaking that down further:
Number of people living without electricity Region Millions without electricity South Asia 706 Sub-Saharan Africa 547 East Asia 224 Other 101 The GDP (Gross Domestic Product) of the 41 Heavily Indebted Poor Countries (567 million people) is less than the wealth of the world’s 7 richest people combined.Source 18
World gross domestic product (world population approximately 6.5 billion) in 2006 was $48.2 trillion in 2006.
- The world’s wealthiest countries (approximately 1 billion people) accounted for $36.6 trillion dollars (76%).
- The world’s billionaires — just 497 people (approximately 0.000008% of the world’s population) — were worth $3.5 trillion (over 7% of world GDP).
- Low income countries (2.4 billion people) accounted for just $1.6 trillion of GDP (3.3%)
- Middle income countries (3 billion people) made up the rest of GDP at just over $10 trillion (20.7%).Source 19
The world’s low income countries (2.4 billion people) account for just 2.4% of world exportsSource 20
The total wealth of the top 8.3 million people around the world
rose 8.2 percent to $30.8 trillion in 2004, giving them control of nearly a quarter of the world’s financial assets.
In other words, about 0.13% of the world’s population controlled 25% of the world’s financial assets in 2004.
A conservative estimate for 2010 finds that at least a third of all private financial wealth, and nearly half of all offshore wealth, is now owned by world’s richest 91,000 people – just 0.001% of the world’s population.
The next 51 percent of all wealth is owned by the next 8.4 million — just 0.14% of the world’s population. Almost all of it has managed to avoid all income and estate taxes, either by the countries where it has been invested and or where it comes fromSource 21
For every $1 in aid a developing country receives, over $25 is spent on debt repayment.Source 22
51 percent of the world’s 100 hundred wealthiest bodies are corporations.Source 23
The wealthiest nation on Earth has the widest gap between rich and poor of any industrialized nation.Source 24
The poorer the country, the more likely it is that debt repayments are being extracted directly from people who neither contracted the loans nor received any of the money.Source 25
In 1960, the 20% of the world’s people in the richest countries had 30 times the income of the poorest 20% — in 1997, 74 times as much.Source 26
An analysis of long-term trends shows the distance between the richest and poorest countries was about:
- 3 to 1 in 1820
- 11 to 1 in 1913
- 35 to 1 in 1950
- 44 to 1 in 1973
- 72 to 1 in 1992Source 27
Approximately 790 million people in the developing world are still chronically undernourished, almost two-thirds of whom reside in Asia and the Pacific.
Source 28For economic growth and almost all of the other indicators, the last 20 years [of the current form of globalization, from 1980 - 2000] have shown a very clear decline in progress as compared with the previous two decades [1960 - 1980]. For each indicator, countries were divided into five roughly equal groups, according to what level the countries had achieved by the start of the period (1960 or 1980). Among the findings:
- Growth: The fall in economic growth rates was most pronounced and across the board for all groups or countries.
- Life Expectancy: Progress in life expectancy was also reduced for 4 out of the 5 groups of countries, with the exception of the highest group (life expectancy 69-76 years).
- Infant and Child Mortality: Progress in reducing infant mortality was also considerably slower during the period of globalization (1980-1998) than over the previous two decades.
- Education and literacy: Progress in education also slowed during the period of globalization.Source 29
A mere 12 percent of the world’s population uses 85 percent of its water, and these 12 percent do not live in the Third World.Source 30
Consider the global priorities in spending in 1998
Global Priority $U.S. Billions Cosmetics in the United States 8 Ice cream in Europe 11 Perfumes in Europe and the United States 12 Pet foods in Europe and the United States 17 Business entertainment in Japan 35 Cigarettes in Europe 50 Alcoholic drinks in Europe 105 Narcotics drugs in the world 400 Military spending in the world 780 And compare that to what was estimated as additional costs to achieve universal access to basic social services in all developing countries:
Global Priority $U.S. Billions Basic education for all 6 Water and sanitation for all 9 Reproductive health for all women 12 Basic health and nutrition 13
Notes and Sources
-
Sources:
- Shaohua Chen and Martin Ravallion, The developing world is poorer than we thought, but no less successful in the fight against poverty 1, World Bank, August 2008
- For the 95% on $10 a day, see Martin Ravallion, Shaohua Chen and Prem Sangraula, Dollar a day revisited 2, World Bank, May 2008. They note that 95% of developing country population lived on less than $10 a day. Using 2005 population numbers, this is equivalent to just under 79.7% of world population, and does not include populations living on less than $10 a day from industrialized nations.
This figure is based on purchasing power parity (PPP3), which basically suggests that prices of goods in countries tend to equate under floating exchange rates and therefore people would be able to purchase the same quantity of goods in any country for a given sum of money. That is, the notion that a dollar should buy the same amount in all countries. Hence if a poor person in a poor country living on a dollar a day moved to the U.S. with no changes to their income, they would still be living on a dollar a day.
The new poverty line of $1.25 a day was recently announced by the World Bank (in 2008). For many years before that it had been $1 a day. But the $1 a day used then would be $1.45 a day now if just inflation was accounted for.
The new figures from the World Bank therefore confirm concerns that poverty has not been reduced by as much as was hoped, although it certainly has dropped since 1981.
However, it appears that much of the poverty reduction in the last couple of decades almost exclusively comes from China:
- China’s poverty rate fell from 85% to 15.9%, or by over 600 million people
- China accounts for nearly all the world’s reduction in poverty
- Excluding China, poverty fell only by around 10%

The use of the poverty line of $1 a day had long come under criticism for seeming arbitrary and using poor quality and limited data thus risking an underestimate of poverty. The $1.25 a day level is accompanied with some additional explanations and reasoning, including that it is a common level found amongst the poorest countries, and that $2.50 represents a typical poverty level amongst many more developing countries.
The $10 dollar a day figure above is close to poverty levels in the US, so is provided here to give a more global perspective to these numbers, although the World Bank has felt it is not a meaningful number for the poorest because they are unfortunately unlikely to reach that level any time soon.
For further details on this (as well as some additional charts), see Poverty Around The World4 on this web site. back
- 2007 Human Development Report5 (HDR), United Nations Development Program, November 27, 2007, p.25.
- Ibid
- See Today, around 21,000 children died around the world6 from this web site. (Note that the statistic cited uses children as those under the age of five. If it was say 6, or 7, the numbers would be even higher.)
-
See the following:
- 2007 Human Development Report7 (HDR), United Nations Development Program, November 27, 2007, p.25. (The report also notes that although India is rising economically,
the bad news is that this has not been translated into accelerated progress in cutting under-nutrition. One-half of all rural children [in India] are underweight for their age—roughly the same proportion as in 1992.
) - Millennium Development Goals Report 20078
- 2007 Human Development Report7 (HDR), United Nations Development Program, November 27, 2007, p.25. (The report also notes that although India is rising economically,
- Millennium Development Goals Report 20079. The report importantly notes that
As high as this number seems, surveys show that it underestimates the actual number of children who, though enrolled, are not attending school. Moreover, neither enrolment nor attendance figures reflect children who do not attend school regularly. To make matters worse, official data are not usually available from countries in conflict or post-conflict situations. If data from these countries were reflected in global estimates, the enrolment picture would be even less optimistic.
- The State of the World’s Children, 199910, UNICEF
- State of the World11, Issue 287 - Feb 1997, New Internationalist
- 2007 Human Development Report12 (HDR), United Nations Development Program, November 27, 2007, p.25.
- 2006 United Nations Human Development Report 13, pp.6, 7, 35
- State of the World’s Children, 2005 14, UNICEF
- 2007 Human Development Report15 (HDR), United Nations Development Program, November 27, 2007, p.25.
- Millennium Development Goals Report 200716
- Ibid, p.45
- Ibid, p.45
- World Development Indicators 2008 17, World Bank, August 2008
- Millennium Development Goals Report 200718, p.44
- See the following:
- See the following:
- Trade Data24, World Bank Data & Statistics, accessed March 3, 2008
- Eileen Alt Powell, Some 600,000 join millionaire ranks in 2004 25, Associate Press, June 9, 2005; James Henry, The Price of Offshore Revisited26, Tax Justice Network, July 2012, p.36
- Based on World Bank data (accessed March 3, 2008) as follows:
- See the following:
- Log cabin to White House? Not any more31, The Observer, April 28, 2002
- Debt - The facts32, Issue 312 - May 1999, New Internationalist
- 1999 Human Development Report33, United Nations Development Programme
- Ibid
- World Resources Institute Pilot Analysis of Global Ecosystems, February 2001, (in the Food Feed and Fiber section34). Note, that despite the food production rate being better than population growth rate, there is still so much hunger around the world.
- The Scorecard on Globalization 1980-2000: Twenty Years of Diminished Progress 35, by Mark Weisbrot, Dean Baker, Egor Kraev and Judy Chen, Center for Economic Policy and Research, August 2001.
- Maude Barlow, Water as Commodity - The Wrong Prescription36, The Institute for Food and Development Policy, Backgrounder, Summer 2001, Vol. 7, No. 3
- The state of human development 37, United Nations Human Development Report 1998, Chapter 1, p.37)
0 articles on “Poverty Facts and Stats” and 2 related issues:
Causes of Poverty
Poverty is the state for the majority of the world’s people and nations. Why is this? Is it enough to blame poor people for their own predicament? Have they been lazy, made poor decisions, and been solely responsible for their plight? What about their governments? Have they pursued policies that actually harm successful development? Such causes of poverty and inequality are no doubt real. But deeper and more global causes of poverty are often less discussed.
Read “Causes of Poverty” to learn more.
Trade, Economy, & Related Issues
Read “Trade, Economy, & Related Issues” to learn more.
Author and Page Information
- Created:
- Last updated: