 Global Issues
Today, around 21,000 children died around the world
Author and Page information
- This page: https://www.globalissues.org/article/715/today-21000-children-died-around-the-world.
- To print all information (e.g. expanded side notes, shows alternative links), use the print version:
Some 21,000 children die every day around the world.
That is equivalent to:
- 1 child dying every 4 seconds
- 14 children dying every minute
- A 2011 Libya conflict-scale death toll every day
- A 2010 Haiti earthquake occurring every 10 days
- A 2004 Asian Tsunami occurring every 11 days
- An Iraq-scale death toll every 19–46 days
- Just under 7.6 million children dying every year
- Some 92 million children dying between 2000 and 2010
The silent killers are poverty, hunger, easily preventable diseases and illnesses, and other related causes. Despite the scale of this daily/ongoing catastrophe, it rarely manages to achieve, much less sustain, prime-time, headline coverage.
On this page:
Some more numbers on the state of the world’s children
From UNICEF, the world’s premier children’s organization, part of the United Nations:
- 2.5 billion people lack access to improved sanitation
- 1 billion children are deprived of one or more services essential to survival and development
- 148 million under 5s in developing regions are underweight for their age
- 101 million children are not attending primary school, with more girls than boys missing out
- 22 million infants are not protected from diseases by routine immunization
- 7.6 million children worldwide died before their 5th birthday in 2010
- 4 million newborns worldwide are dying in the first month of life
- 2 million children under 15 are living with HIV
- >500,000 women die each year from causes related to pregnancy and childbirth
Source: State of the World’s Children, 2010 , UNICEF, p.18-19. See also ChildInfo.
Why is this tragedy not in the headlines?
Back in 2000, UNICEF’s Progress of Nations report for that year tried to put these numbers into some perspective:
The continuation of this suffering and loss of life contravenes the natural human instinct to help in times of disaster. Imagine the horror of the world if a major earthquake were to occur and people stood by and watched without assisting the survivors! Yet every day, the equivalent of a major earthquake killing over 30,000 young children occurs to a disturbingly muted response. They die quietly in some of the poorest villages on earth, far removed from the scrutiny and the conscience of the world. Being meek and weak in life makes these dying multitudes even more invisible in death.
Unfortunately, it seems that the world still does not notice. It might be reasonable to expect that death and tragedy on this scale should be prime time headlines news. Yet, these issues only surface when there are global meetings or concerts (such as the various G8 summits, the Make Poverty History campaign in 2005, etc).

Furthermore, year after year, we witness that when those campaigns end and the meetings conclude, so does the mainstream media coverage.
It feels as though even when there is some media attention, the ones who suffer are not the ones that compel the mainstream to report, but instead it is the movement of the celebrities and leaders of the wealthy countries that makes this issue newsworthy.
Even rarer in the mainstream media is any thought that wealthy countries may be part of the problem too. The effects of international policies such as structural adjustments, the current form of globalization, and the influence wealthy countries have had for decades on these processes is rarely looked at.
Instead, promises and pledges from the wealthy, powerful countries, and the corruption of the poorer ones — who receive apparently abundant goodwill — make the headlines; the repeated broken promises, the low quality and quantity of aid, and conditions with unfair strings attached do not.
Accountability of the recipient countries is often mentioned when these issues touch the mainstream. Accountability of the roles that international institutions such as the World Bank and IMF, and their funders (the wealthy/powerful countries), rarely does. The risk is that citizens of these countries get a false sense of hope creating the misleading impression that appropriate action is taken in their names.
It may be harsh to say the mainstream media is one of the many causes of poverty, as such, but the point here is that their influence is enormous. Silence, as well as noise, can both have an effect.
Recent headlines in context
When this page was initially written, the BBC’s top story on prime time television was about a British child kidnapped in Portugal. This is definitely a tragic story that needs reporting, but why, for the BBC and other British media outlets that pride themselves in outstanding international media coverage, is the plight of millions of children not daily headlines?
Another recent tragedy that sustained days of headline and prime time media coverage was the Virginia Tech massacre’s in the US. When media critics at Media Lens asked for the BBC’s rationale for such sustained coverage compared to more people dying each day in Iraq and receiving just a few minutes in comparison, the BBC responded that it happens every day in Iraq. See Putting Virginia Tech in Perspective for the follow up from Media Lens.
Some people fear there will be fatigue at hearing those depressing stories all the time, or the advertisers will pressure the media companies to put a bit more entertainment or good news on so that buying moods are not affected.
And does it have to be just bad news? Despite the tragedy, there is some measure of progress, which, perhaps with further public attention, could spur on more efforts in these areas and highlight important related issues.
However, news of tragedies in Iraq are also depressing, but nevertheless do received regular headline coverage.
Also there is worry that the lack of sensationalism attached to reporting the same news story each day will result in lower television viewing ratings and this may have various consequences—especially where advertising is concerned.
Finally there is the question of whether people want to hear about such depressing news stories. After all the media feels it is delivering what its viewers would like. However, it is difficult for people to know what they do or do not want to see, if they are never given the options of the alternatives. If the magnitude of this suffering is hardly reported in a sustained manner, how can viewers judge whether they wish to watch it or not?
About Child Deaths
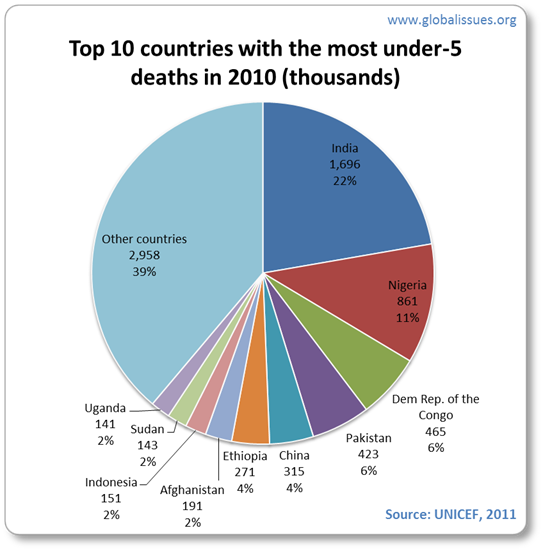
Of the 7.6 million child deaths (under-5s) in 2010, the vast majority occurred in just two regions:

Breaking that down further,
Why is child mortality important to understand?
UNICEF summarizes the importance of child mortality:
The under-five mortality rate, often known by its acronym U5MR or simply as the child mortality rate … has several advantages as a barometer of child well-being in general and child health in particular.
First, it measures an ‘outcome’ of the development process rather than an ‘input’, such as per capita calorie availability or the number of doctors per 1,000 population—all of which are means to an end.
Second, the U5MR is known to be the result of a wide variety of inputs:
- the nutritional status and the health knowledge of mothers;
- the level of immunization and oral rehydration therapy;
- the availability of maternal and child health services (including prenatal care);
- income and food availability in the family;
- the availability of safe drinking water and basic sanitation; and
- the overall safety of the child’s environment
… among other factors.
Third, the U5MR is less susceptible to the fallacy of the average than, for example, per capita gross national income (GNI per capita). This is because the natural scale does not allow the children of the rich to be 1,000 times as likely to survive, even if the human-made scale does permit them to have 1,000 times as much income. In other words, it is much more difficult for a wealthy minority to affect a nation’s U5MR, and it therefore presents a more accurate, if far from perfect, picture of the health status of the majority of children (and of society as a whole).
Cautious optimism in reducing child mortality
UNICEF also notes that the global child mortality rate declined by over a third between 1990 and 2010:
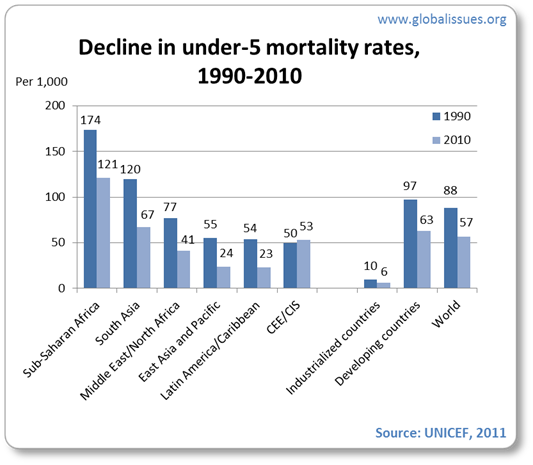
Progress has certainly been made as each year the number of children under 5 dying is slowly coming down. However, as UNICEF cautioned in their State of the World’s Children, 2008 report, progress has been unevenly distributed
(p.25). For example, good progress was made by a few nations with large populations, but many countries made no progress or insufficient progress
(p.iii)
Also of concern is that the global financial crisis, largely the making of rich countries, is affecting the poorest. Margaret Chan, director-general of the WHO, estimates between 200,000 and 400,000 additional children will die because of this global financial crisis.
UNICEF’s State of the World Report 2010 was compiled in August 2009. They noted at the time, The risks to child rights from the current economic crisis and other external challenges must not be underestimated.
(p. 60). Furthermore, The full impact of the crisis on child rights will not be evident for some time, and will only become apparent as new international estimates of global poverty, child development and nutrition emerge.
(p.62)
Notes and Sources
Sources for child deaths
These mortality figures are from UNICEF. 92 million covers deaths between 2000 and 2010, the latest figures from UNICEF at time of writing.
The term Children
in this context means infants under the age of 5. The tragedy is therefore even worse if older children, adults, and the elderly are to be considered.
The approximate number of deaths in those 10 years is calculated by averaging the deaths per year for known figures in that range and multiplying by the 11 years that cover 2000-2010, which gives a total of 92 million deaths.
Given the population is increasing, the percent of deaths being reduced over those 11 years seems small (0.16% of world population in 2000 and 0.11% of population in 2010).
In a way, this feels like a very small reduction given that many of the illnesses and conditions that children suffer are easily preventable, technically.
Taking a longer term view, since 1960 (when child mortality numbers were first being recorded) the annual number of child deaths has more than halved, from around 20 million in 1960 to just 7.6 million in 2010.
The rate of reduction varies by region, with poorer regions having higher child mortality rates, though all regions are seeing a reduction as the years go by:
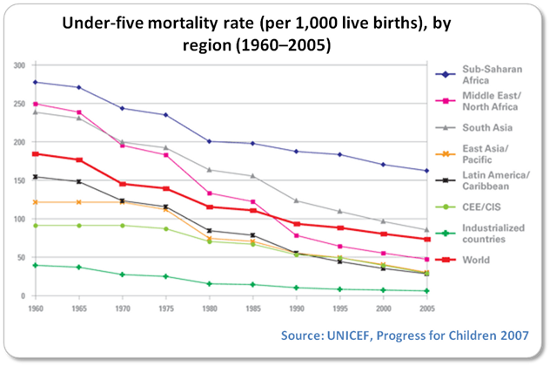
In addition, given the population in 1960 was 3 billion whereas 2010 was about 6.8 billion this means that there has been a six-fold improvement in saving lives of children from a percentage basis. That is, although population has increased (a lot), the number of child deaths has reduced even more.
Note also, the above numbers are not precise; the estimation techniques improve with more data, so for 1960 the data and estimates may not be as reliable as more recent years, but it gives an idea of the reduction achieved so far. The 1960 figure comes from a 2007 UNICEF report as the latest figures from UNICEF do not include 1960s number of deaths (unless I missed it!), but nonetheless the results should at least give a rough idea of the trend.
The sources are typically the UNICEF web site and their progress of nations reports. They have a statistical database, which (at the time of writing) uses 2010 as the latest available data. The childinfo.org web site, also by UNICEF, presents these statistics, too.
| Year | Per year (millions) | Per day | Per hour | Per minute | Per second | Population (approx) | % |
|---|---|---|---|---|---|---|---|
Values rounded for display. Sources:
Note, the UNICEF data for previous years is different to their earlier reports for those years (due to changes in ways estimates are done, additional data, etc.) Hence, for example, this page previously reported over 22,000 child deaths per day for 2009, which is now just over 21,000 with latest figures. | |||||||
| 1990 | 12.0 | 32,904 | 1,371 | 23 | 0.38 | 5.2 billion | 0.23% |
| 1995 | 10.7 | 29,320 | 1,222 | 20 | 0.34 | 5.7 billion | 0.19% |
| 2000 | 9.6 | 26,232 | 1,093 | 18 | 0.30 | 6.1 billion | 0.16% |
| 2005 | 8.5 | 23,197 | 967 | 16 | 0.27 | 6.5 billion | 0.13% |
| 2009 | 7.8 | 21,249 | 885 | 15 | 0.25 | 6.8 billion | 0.11% |
| 2010 | 7.6 | 20,860 | 869 | 14 | 0.25 | 6.8 billion | 0.11% |
Sources for Libya comparison
The 2011 Libyan conflict/civil war has been difficult to get accurate death tolls for. Wikipedia lists a number of different sources that say between 10,000 and 30,000 deaths between February and September 2011 (though not all go as far as September).
At 21,000 child deaths per day, that would be approximately 0.5 to 1.5 days.
Sources for Haiti comparison
The BBC reports that Haiti’s government says about 230,000 people died
in the devastating earthquake in January 2010, although later, a minister said there were 217,000 verified deaths.
At 20,860 deaths per day, that would be 10 – 11 days approximately.
Sources for Asia Tsunami comparison
This site’s article, Asian Tsunami in December 2004, notes that approximately 230,000 people died in that disaster.
At 20,860 deaths per day, that would be about 11 days.
Sources for Iraq comparison
For the Iraq estimate, the John Hopkins study (reported in the Lancet) found 400,000 to 950,000 deaths since the 2003 Iraq invasion (average of some 655,000). Dividing 400,000 by 20,860 gives 19, and 950,000 by 20,860 gives 46, approximately.
As an aside, George Bush and many others dismissed this study in the Lancet as lacking credibility, using discredited methodologies, and instead used the Iraq Body Count statistics (of 30,000 at the time, though it is now reported at about 66,000).
If Iraq Body Count statistics are to be used, then the number of days in which child deaths match the post 2003 Iraq death toll is just two or three days. The Iraq Body Count statistics are often criticized because they rely on mainstream media reporting, which is heavily censored and managed by the US in Iraq. Nonetheless they provided criticism of the John Hopkins study (often referred to as the Lancet study as that is where it was published).
The authors of the study defended it noting that they used the very methodology that the US government is teaching others (and thus dismissed Bush’s claim of using discredited methodologies). The full report in the Lancet also notes that casualty reporting in war time tends to be grossly underestimated, so their numbers may not be as hard to accept as it initially sounds. This caused controversy when reported in October 2006, and is detailed further on this site’s Iraq media reporting section which includes the relevant links.
Related Information
Throughout this site, many issues are discussed that rarely sustain (or enter) mainstream media coverage. The articles listed below are ones that provide a bit more detail behind the above figures.
- Poverty facts and stats
- G8 Summit 2005—an example of the paradox of extensive media coverage but of only a few issues
- Mainstream Media
- Health Issues
See also Poverty.com for more interactive information and ChildInfo for more data based on the UNICEF statistics.
Author and Page Information
- Created:
- Last updated: