

Climate Change and Global Warming Introduction
Author and Page information
- This page: https://www.globalissues.org/article/233/climate-change-and-global-warming-introduction.
- To print all information (e.g. expanded side notes, shows alternative links), use the print version:
On this page:
- What is Global Warming and Climate Change?
- What are the main indicators of Climate Change?
- What is the Greenhouse Effect?
- The Greenhouse effect is natural. What do we have to do with it?
- The climate has always varied in the past. How is this any different?
- Doesn’t recent record cold weather disprove Global Warming?
- Has global warming paused due to recent surface temperature drops?
- Most global warming is going into the oceans
- 2014 warmest year since records began
- What are the impacts of Global Warming?
- Rapid changes in global temperature
- Small average global temperature change can have a big impact
- Extreme Weather Patterns
- Ecosystem Impacts
- Rising Sea Levels
- Increasing ocean acidification
- Increase in Pests and Disease
- Failing Agricultural Output; Increase in World Hunger
- Agriculture and livelihoods are already being affected
- Women face brunt of climate change impacts
- Greenhouse gases and emissions resulting from human activity
- Differences in Greenhouse Gas Emission Around the World
- The United States is the World’s Largest Emitter of Greenhouse Gases Per Capita
- The previously 15-member European Union is also large Emitter
- Stalling Kyoto Protocol Gets Push by Russia
- Canada pulls out of Kyoto
- Rich nation emissions have been rising
- Rich Nations Have
Outsourced
Their Carbon Emissions - Developing Countries Affected Most
- Greenhouse gas emissions continue to rise
- Skepticism on Global Warming or That it can be human-induced
- Many Sources Of Greenhouse Gases Being Discovered
- Warming happening more quickly than predicted
What is Global Warming and Climate Change?
Global warming and climate change refer to an increase in average global temperatures. Natural events and human activities are believed to be contributing to an increase in average global temperatures. This is caused primarily by increases in greenhouse
gases such as Carbon Dioxide (CO2).
A warming planet thus leads to a change in climate which can affect weather in various ways, as discussed further below.
What are the main indicators of Climate Change?
As explained by the US agency, the National Oceanic and Atmospheric Administration (NOAA), there are 7 indicators that would be expected to increase in a warming world (and they are), and 3 indicators would be expected to decrease (and they are):

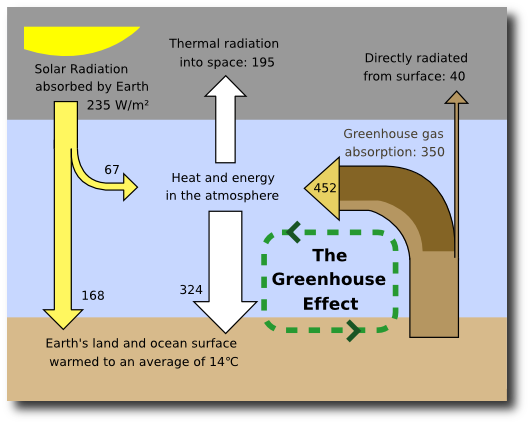
What is the Greenhouse Effect?
The term greenhouse is used in conjunction with the phenomenon known as the greenhouse effect.
- Energy from the sun drives the earth’s weather and climate, and heats the earth’s surface;
- In turn, the earth radiates energy back into space;
- Some atmospheric gases (water vapor, carbon dioxide, and other gases) trap some of the outgoing energy, retaining heat somewhat like the glass panels of a greenhouse;
- These gases are therefore known as greenhouse gases;
- The greenhouse effect is the rise in temperature on Earth as certain gases in the atmosphere trap energy.
Six main greenhouse gases are carbon dioxide (CO2), methane (CH4) (which is 20 times as potent a greenhouse gas as carbon dioxide) and nitrous oxide (N2O), plus three fluorinated industrial gases: hydrofluorocarbons (HFCs), perfluorocarbons (PFCs) and sulphur hexafluoride (SF6). Water vapor is also considered a greenhouse gas.
The Greenhouse effect is natural. What do we have to do with it?
Many of these greenhouse gases are actually life-enabling, for without them, heat would escape back into space and the Earth’s average temperature would be a lot colder.
However, if the greenhouse effect becomes stronger, then more heat gets trapped than needed, and the Earth might become less habitable for humans, plants and animals.
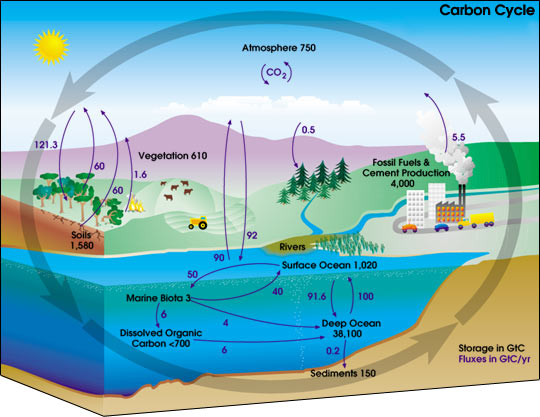
Carbon dioxide, though not the most potent of greenhouse gases, is the most significant one. Human activity has caused an imbalance in the natural cycle of the greenhouse effect and related processes. NASA’s Earth Observatory is worth quoting the effect human activity is having on the natural carbon cycle, for example:
In addition to the natural fluxes of carbon through the Earth system, anthropogenic (human) activities, particularly fossil fuel burning and deforestation, are also releasing carbon dioxide into the atmosphere.
When we mine coal and extract oil from the Earth’s crust, and then burn these fossil fuels for transportation, heating, cooking, electricity, and manufacturing, we are effectively moving carbon more rapidly into the atmosphere than is being removed naturally through the sedimentation of carbon, ultimately causing atmospheric carbon dioxide concentrations to increase.
Also, by clearing forests to support agriculture, we are transferring carbon from living biomass into the atmosphere (dry wood is about 50 percent carbon).
The result is that humans are adding ever-increasing amounts of extra carbon dioxide into the atmosphere. Because of this, atmospheric carbon dioxide concentrations are higher today than they have been over the last half-million years or longer.
Another way of looking at this is with a simple analogy: consider salt and human health:
- A small amount of salt is essential for human life;
- Slightly more salt in our diet often makes food tastier;
- Too much salt can be harmful to our health.
In a similar way, greenhouse gases are essential for our planet; the planet may be able to deal with slightly increased levels of such gases, but too much will affect the health of the whole planet.
The other difference between the natural carbon cycle and human-induced climate change is that the latter is rapid. This means that ecosystems have less chance of adapting to the changes that will result and so the effects felt will be worse and more dramatic it things continue along the current trajectory.
The climate has always varied in the past. How is this any different?
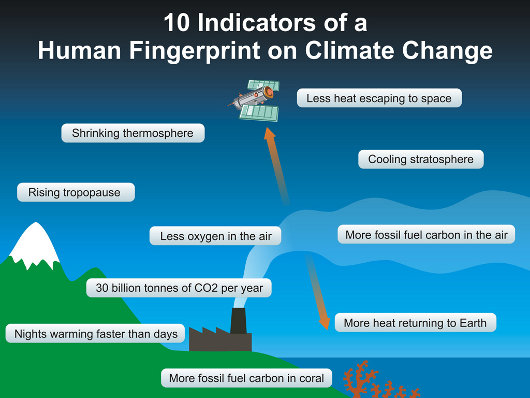
Throughout Earth’s history the climate has varied, sometimes considerably. Past warming does not automatically mean that today’s warming is therefore also natural. Recent warming has been shown to be due to human industrialization processes.
John Cook, writing the popular Skeptical Science blog, summarizes the key indicators of a human finger print on climate change:
This graph, based on the comparison of atmospheric samples contained in ice cores and more recent direct measurements, provides evidence that atmospheric CO2 has increased since the Industrial Revolution:

The above covers hundreds of thousands of years and shows how atmospheric CO2 levels have dramatically increased in recent years. If we zoom
in on just the past 250 years, we see the following:

NASA’s Goddard Institute of Space Studies (GISS) tracks atmospheric global temperature climate trends. As environmental engineer, D Kelly O’Day, explained on ProcessingTrends.com (link no longer available): To facilitate assessments of long term trends, climatologists compare the mean for a base period with the annual mean. Differences between the annual mean and baseline mean are called anomalies. GISS uses the 1951 - 1980 period for their baseline period. They use the difference between the annual mean and the baseline mean to determine the global temperature anomaly for the year.
O’Day originally produced a chart showing global temperature anomalies between 1800 and 2006 using data from NASA. I updated the chart he provided to include recently updated data up to 2014:
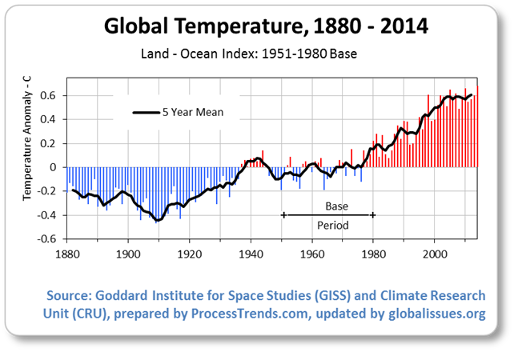
In the 1880 - 1935 period, the temperature anomaly was consistently negative. In contrast, the since 1980 the anomaly has been consistently positive. The 1909 temperature anomaly (-0.47oC) was the lowest year on record. Since 1909, global temperature has warmed, with the most recent years showing the highest anomalies of +0.6 oC in the past 120 years.
A NASA’s GISS animation also shows how most parts of the world have experienced this warming, recently:
modern record.At this time, the coverage provided by weather stations allowed for essentially global temperature data. As greenhouse gas emissions from energy production, industry and vehicles have increased, temperatures have climbed, most notably since the late 1970s. Source: NASA Finds 2014 Warmest Year in Modern Record, NASA Goddard Institute for Space Studies, January 16, 2015
And, as Sir David Attenborough explains, natural variability alone does not explain recent temperature rise:
As well as the links above, see also Skeptical Science, which, while examining the arguments of global warming skepticism, provides information on causes of anthropogenic global warming.
Doesn’t recent record cold weather disprove Global Warming?
In different parts of the world, there have been various weather events that at first thought would question global warming. For example, some regions have experienced extremely cold winters (sometimes record-breaking), while others have experienced heavy rain, etc.
The confusion that sometimes arises is the difference between climate change and weather patterns. Weather patterns describe short term events, while climate change is a longer process that affects the weather. A warming planet is actually consistent with increasing cold, increasing rain and other extremes, as an overall warmer planet changes weather patterns everywhere at all times of the year.
To get an idea of how looking at short term changes only can lead to a conclusion that global warming has stopped, or doesn’t exist, see Alden Griffith’s has global warming stopped?
(As an aside, those crying foul of global warming claims when going through extremely cold weather in Europe for example in 2010, later found their summers to be full of heat waves. The point here is that a specific short period such as a cold winter — or even a hot summer — is not proof alone that global warming has stopped (or increased); short term variability can mask longer term trends.)
This means, for example, increasing temperatures can actually mean more snowfall — at least until it becomes too warm for significant snowfall to happen.
The additional concern, as meteorology professor Scott Mandia explains, it can take decades for the climate temperatures to increase in response to increased greenhouse gas emissions. So up until now, perhaps it has been easier for skeptics to deny climate change is occurring or that humans are responsible.
Has global warming paused due to recent surface temperature drops?
As the IPCC’s fifth major report draws to a conclusion in 2013 it notes that scientists have increased their certainty of human-induced warming to 95%. It was extremely likely that human influence has been the dominant cause of the observed warming since the mid-20th century
, as summarized by the IPCC.
As their fifth report started to come out, a number of climate skeptics and media outlets were arguing that the slowdown shown in surface temperatures in recent years proved global warming had stopped or paused. Yet, this slowdown was in surface temperatures only even though the overall trend (using a more longer period which is more valid in climate change analysis) showed an increase in temperatures. Two simple graphs help illustrate this:
The next graph is an animation from Skeptical Science showing how time-frames to interpret climate data is significant:
For further information on the above see also Does the global warming pause
mean what you think it means?, from Skeptical Science.
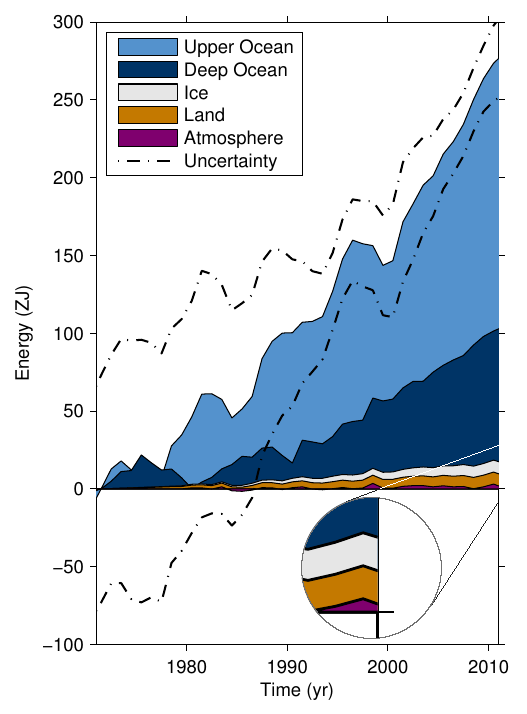
Most global warming is going into the oceans
As this infographic shows, most of the warming is going into the oceans:
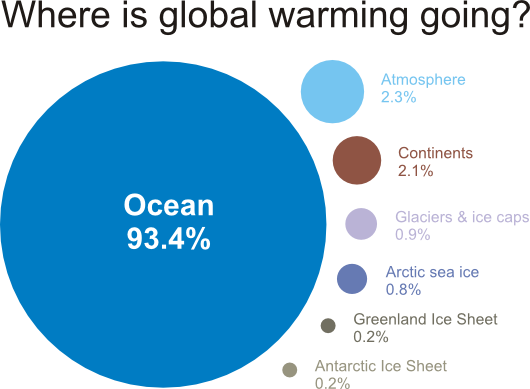
As John Cook, creator of the graphic above says (see above link), Just as it takes time for a cup of coffee to release heat into the air, so to it takes time for the ocean to release its heat into the atmosphere.
.
The implications of this is further explained with Inter Press Service’s freezer analogy: The world’s northern freezer is on rapid defrost as large volumes of warm water are pouring into the Arctic Ocean, speeding the melt of sea ice.
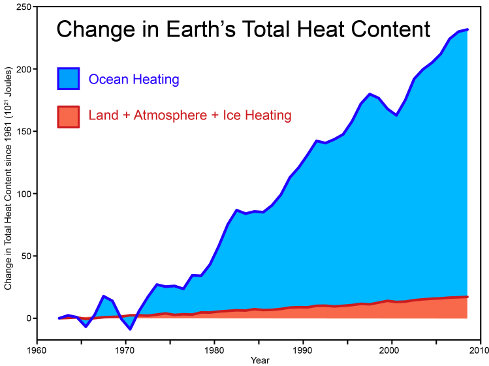
Indeed, as this chart also shows, the warming in the oceans has been occurring for quite some time:
One of John Bruno’s colleagues, Ove Hoegh-Guldberg, talks about the impact climate change will have on ocean ecosystems. A summary of the video here says that
Rapidly rising greenhouse gas concentrations are driving ocean systems toward conditions not seen for millions of years, with an associated risk of fundamental and irreversible ecological transformation. Changes in biological function in the ocean caused by anthropogenic climate change go far beyond death, extinctions and habitat loss: fundamental processes are being altered, community assemblages are being reorganized and ecological surprises are likely.
D. Salmons also has a post at Skeptical Science that explains the impact of warming Arctic’s relation to the very cold recent winters further, using the following NASA map:
As Salmons explains,
the Arctic has been heating up, and studies show that is happening at two to three times the global average. This rising temperature in the Arctic has served to reduce the region’s floating ice layer by more than 20%. And as you would expect, when the reflective ice and snow layer is stripped away, it leaves a dark blue sea.
Now, what does the effect of the dark blue sea being exposed have on the Arctic area? Well, the ice and snow layer reflects the majority of the sun’s rays harmlessly back into space. But the dark blue of the exposed sea absorbs the rays, aiding the heating process.
2014 warmest year since records began
NASA’s GISS Surface Temperature Analysis graph shown earlier (from 1800 to 2014) shows that temperature anomalies since 1980 have all been positive; i.e. it has been constantly hotter than normal.
As the same data shows, the hottest years have all been since 1998:
| Rank 1 = Warmest 1880–2014 | Year | Anomaly °C | Anomaly °F |
|---|---|---|---|
Source: NOAA National Climatic Data Center, State of the Climate: Global Analysis for Annual 2014, published online December 2014, retrieved on January 25, 2015 | |||
| 1 | 2014 | 0.69 | 1.24 |
| 2 (tie) | 2010 | 0.65 | 1.17 |
| 2 (tie) | 2005 | 0.65 | 1.17 |
| 4 | 1998 | 0.63 | 1.13 |
| 5 (tie) | 2013 | 0.62 | 1.12 |
| 5 (tie) | 2003 | 0.62 | 1.12 |
| 7 | 2002 | 0.61 | 1.10 |
| 8 | 2006 | 0.60 | 1.08 |
| 9 (tie) | 2009 | 0.59 | 1.06 |
| 9 (tie) | 2007 | 0.59 | 1.06 |
What are the impacts of Global Warming?
For decades, greenhouse gases, such as carbon dioxide have been increasing in the atmosphere. But why does that matter? Won’t warmer weather be nicer for everyone?
Rapid changes in global temperature
Increased greenhouse gases and the greenhouse effect has contributed to an overall warming of the Earth’s climate, leading to a global warming (even though some regions may experience cooling, or wetter weather, while the temperature of the planet on average would rise).
Consider also the following:
While year-to-year changes in temperature often reflect natural climatic variations such as El Niño/La Niña events, changes in average temperature from decade-to-decade reveal long-term trends such as global warming. Each of the last three decades has been much warmer than the decade before. At the time, the 1980s was the hottest decade on record. In the 1990s, every year was warmer than the average of the previous decade. The 2000s were warmer still.
At the end of the 1990s, the World Meteorological Organization (WMO) had noted that not only was the 1990s the warmest decade but at the time, the 1900s was the warmest century during the last 1,000 years.
It is the rapid pace at which the temperature will rise that will result in many negative impacts to humans and the environment and this why there is such a world-wide concern.
Small average global temperature change can have a big impact
Climate scientists admit that the chances of the world keeping average global temperature at current levels are not going to be possible (humanity has done little to address things in the past couple of decades that these concerns have been known about).
So, now, there is a push to contain temperature rises to an average 2°C increase (as an average, this means some regions may get higher temperatures and others, lower).
Even just a 2°C increase can have impacts around the world to biodiversity, agriculture, the oceans etc (detailed further below). But in the lead up to important global climate talks at the end of 2009, some delegates are skeptical that temperature rises can be contained to a 2°C rise (or C0 2 levels of 350 ppm ).
On October 22, 2009, the British Government and the UK’s Met Office (UK’s National Weather Service) unveiled a new map, showing what would happen if we allowed average global temperatures to increase to 4°C above pre-industrial levels (the high end of the UN IPCC projections):
In short, we would not be able to cope with a 4°C average increase.
As the Met Office noted,
The poster shows that a four degree average rise will not be spread uniformly across the globe. The land will heat up more quickly than the sea, and high latitudes, particularly the Arctic, will have larger temperature increases. The average land temperature will be 5.5 degrees above pre-industrial levels.
The impacts on human activity shown on the map are only a selection….
Agricultural yields are expected to decrease for all major cereal crops in all major regions of production. Half of all Himalayan glaciers will be significantly reduced by 2050, leading to 23% of the population of China being deprived of the vital dry season glacial melt water source.
Extreme Weather Patterns
Most scientists believe that the warming of the climate will lead to more extreme weather patterns such as:
- More hurricanes and drought;
- Longer spells of dry heat or intense rain (depending on where you are in the world);
- Scientists have pointed out that Northern Europe could be severely affected with colder weather if climate change continues, as the arctic begins to melt and send fresher waters further south. It would effectively cut off the Gulf Stream that brings warmth from the Gulf of Mexico, keeping countries such as Britain warmer than expected;
- In South Asia, the Himalayan glaciers could retreat causing water scarcity in the long run.
While many environmental groups have been warning about extreme weather conditions for a few years, the World Meteorological Organization announced in July 2003 that Recent scientific assessments indicate that, as the global temperatures continue to warm due to climate change, the number and intensity of extreme events might increase.
The WMO also notes that New record extreme events occur every year somewhere in the globe, but in recent years the number of such extremes have been increasing.
(The WMO limits the definition of extreme events to high temperatures, low temperatures and high rainfall amounts and droughts.) The U.K’s Independent newspaper described the WMO’s announcement as unprecedented
and astonishing
because it came from a respected United Nations organization not an environmental group!
Super-storms
Mentioned further above was the concern that more hurricanes could result. The link used was from the environmental organization WWF, written back in 1999. In August/September 2004 a wave of severe hurricanes left many Caribbean islands and parts of South Eastern United States devastated. In the Caribbean many lives were lost and there was immense damage to entire cities. In the U.S. many lives were lost as well, some of the most expensive damage resulted from the successive hurricanes.
In its wake, scientists have reiterated that such super-storms may be a sign of things to come. Global warming may spawn more super-storms
, Inter Press Service (IPS) notes.
Interviewing a biological oceanography professor at Harvard University, IPS notes that the world’s oceans are approaching 27 degrees C or warmer during the summer. This increases the odds of major storms.
- When water reaches such temperatures, more of it evaporates, priming hurricane or cyclone formation.
- Once born, a hurricane needs only warm water to build and maintain its strength and intensity.
Furthermore, as emissions of greenhouse gases continue to trap more and more of the sun’s energy, that energy has to be dissipated, resulting in stronger storms, more intense precipitation and higher winds.
There is abundant evidence of an unprecedented number of severe weather events in the past decade, [professor of biological oceanography at Harvard University, James] McCarthy says. In 1998, Hurricane Mitch killed nearly 20,000 people in Central America, and more than 4,000 people died during disastrous flooding in China. Bangladesh suffered some of its worst floods ever the following year, as did Venezuela. Europe was hit with record floods in 2002, and then a record heat wave in 2003.
More recently, Brazil was struck by the first-ever recorded hurricane in the South Atlantic last March.
Weather records are being set all the time now. We’re in an era of unprecedented extreme weather events,McCarthy said.Historical weather patterns are becoming less useful for predicting the future conditions because global warming is changing ocean and atmospheric conditions.
In 30 to 50 years’ time, the Earth’s weather generating system will be entirely different,he predicted.
Extreme weather events on the increase
Looking at 2010 as a whole year revealed a variety of extreme weather events. A panel of climate and weather experts ranked the top 10 global weather/climate events of 2010 which included heat waves to droughts to negative arctic oscillation (a climate pattern where cold Arctic air slides south while warmer air moves north, bringing snow storms and record cold temperatures to much of the Northern Hemisphere) show that a variety of weather events can occur as a result of changing climate:
| Rank | Event | When Occurred | Description |
|---|---|---|---|
Source: Top Ten Global Weather/Climate Events of 2010 National Climatic Data Center, NOAA, December 2010 These lists were compiled and voted on during the first week of December. Significant events, such as the extreme winter weather in Europe and the flooding in Australia occurred after this date. These events have been included in an additional section titled, | |||
| 1 | Russo- European- Asian Heat Waves | Summer | A severe summer spawned drought, wildfires and crop failures across western Russia, where more than 15,000 people died. All-time high temperatures occurred in many cities and nations in the region. China faced locust swarms during July. |
| 2 | 2010 as [near] warmest on record | Calendar Year | According to NOAA, the globally-averaged temperature for 2010 will finish among the two warmest, and likely the warmest, on record. Three months in 2010 were the warmest on record for that month. |
| 3 | Pakistani Flooding | Late July into August | Rainfall related to the Asian Monsoon was displaced unusually westward, and more than a foot of rain fell across a large area of the Upper Indus Valley. Subsequent flooding down the Indus River killed 1,600 people and displaced millions. |
| 4 | El Niño to La Niña Transition | Mid-to-Late Boreal Spring | ENSO, the most prominent and far-reaching patterns of climate variability, saw a huge swing in mid-2010. Only 1973, 1983 and 1998 have seen larger within-year swings. |
| 5 | Negative Arctic Oscillation | December–February | The AO Index, which is strongly correlated with wintertime cold air outbreaks, reached -4.27 for February, the largest negative anomaly since records began in 1950. Major cold air outbreaks occurred throughout the Northern Hemisphere. |
| 6 | Brazilian Drought | Ongoing | A severe drought parching northern Brazil shrunk the Rio Negro, one of the Amazon River's most important tributaries, to its lowest level since records began in 1902 at its confluence with the Amazon. The Amazon's depth there fell more than 12 feet below its average. |
| 7-tie | Historically Inactive NE Pacific Hurricane Season | May 15th–November 30th | The Northeast Pacific Hurricane Season was one of the least active on record, produced the fewest named storms and hurricanes of the modern era, and had the earliest cessation of tropical activity (Sep 23) on record. |
| 7-tie | Historic N. Hemispheric Snow Retreat | January through June | Despite December 2009 having the second-largest snow cover extent of the satellite record (mid-1960s), the melt season was ferocious, contributing to spring floods in the Northern U.S. and Canada. Following the early and pronounced snow melt, the North American, Eurasian and Hemispheric snow cover was the smallest on record for May and June 2010. |
| 9 | Minimum Sea Ice Extent | Mid-September | The 2010 sea ice minimum of 4.9 million sq km was the third smallest on record. The last four years (2007-2010) are the four smallest on record. The Northwest Passage and the Northern Sea Route were simultaneously ice-free in September, a first in modern history. |
| 10 | China Drought | First half of 2010 | A persistent drought centered in the Yunan Province was touted as perhaps the worst in this region in more than 100 years. Major crop losses and lack of drinking water created severe problems for local residents. |
Ecosystem Impacts
With global warming on the increase and species’ habitats on the decrease, the chances for various ecosystems to adapt naturally are diminishing.
Many studies have pointed out that the rates of extinction of animal and plant species, and the temperature changes around the world since the industrial revolution, have been significantly different to normal expectations.
An analysis of population trends, climate change, increasing pollution and emerging diseases found that 40 percent of deaths in the world could be attributed to environmental factors.
Jaan Suurkula, M.D. and chairman of Physicians and Scientists for Responsible Application of Science and Technology (PSRAST), paints a dire picture, but notes that he is only citing observations and conclusions from established experts and institutions. Those observations and conclusions note that global warming will lead to the following situations, amongst others:
- Rapid global heating according to a US National Academy of Science warning;
- Dramatic increase in greenhouse gas emissions;
- Ozone loss aggravated by global warming;
- Ozone loss likely to aggravate global warming;
- Warming of the oceans leads to increased green house gasses;
- Permafrost thawing will aggravate global warming;
- Oceanic changes observed that may aggravate the situation;
- A vicious circle whereby each problem will exacerbate other problems which will feedback into each other;
- Massive extinction of species will aggravate the environmental crisis;
- Sudden collapse of biological and ecological systems may occur, but will have a very slow recovery;
- While effective measures can decrease global warming and other problems the World community has repeatedly failed to establish cooperation.
The vicious circle
Suurkula refers to is worth expanding. In his own words, but slightly reformatted:
The ongoing accumulation of greenhouse gasses causes increasing global warming.
- This causes a more extensive destruction of ozone in the polar regions because of accentuated stratospheric cooling.
- An increase of ozone destruction increases the UV-radiation that, combined with higher ocean temperature, causes a reduction of the gigantic carbon dioxide trapping mechanism of the oceanic phytoplankton biomass;
- This accentuates the warming process.
- When the warming has reached a certain level, it will release huge amounts of greenhouse gasses trapped in the permafrost.
- This will enhance the global warming, and the polar destruction of ozone, and so on.
- The observed decrease of the thermohaline circulation [the various streams that transport warm and cold waters around the world and therefore has an important stabilizing effect on world climate] further aggravates the situation.
This is a global self-reinforcing vicious circle accelerating the global warming.
Rising Sea Levels
Water expands when heated, and sea levels are expected to rise due to climate change. Rising sea levels will also result as the polar caps begin to melt.
Rising sea levels is already affecting many small islands.
The WorldWatch Institute reports that [t]he Earth’s ice cover is melting in more places and at higher rates than at any time since record keeping began
. (March 6, 2000).
Rising sea levels will impact many coastlines, and a large mass of humanity lives near the coasts or by major rivers. Analysis by the World Wildlife Fund has found that many cities are unprepared for climate change effects such as rising sea levels.
Increasing ocean acidification
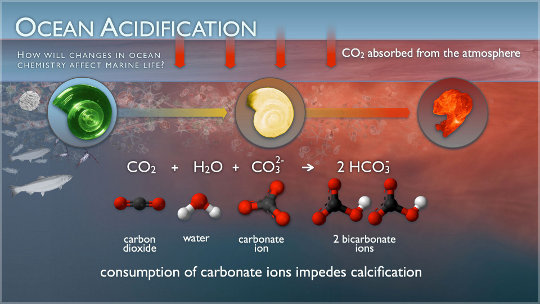
Although it has gained less mainstream media attention, the effects of increasing greenhouse emissions — in particular carbon dioxide — on the oceans may well be significant.
As explained by the US agency, the National Oceanic and Atmospheric Administration (NOAA), the basic chemistry of ocean acidification is well understood.
These are the 3 main concepts:
- More CO2 in the atmosphere means more CO2 in the ocean;
- Atmospheric CO2 is dissolved in the ocean, which becomes more acidic; and
- The resulting changes in the chemistry of the oceans disrupts the ability of plants and animals in the sea to make shells and skeletons of calcium carbonate, while dissolving shells already formed.
Scientists have found that oceans are able to absorb some of the excess CO2 released by human activity. This has helped keep the planet cooler than it otherwise could have been had these gases remained in the atmosphere.
However, the additional excess CO2 being absorbed is also resulting in the acidification of the oceans: When CO2 reacts with water it produces a weak acid called carbonic acid, changing the sea water chemistry. As the Global Biodiversity Outlook report explains, the water is some 30% more acidic than pre-industrial times, depleting carbonate ions — the building blocks for many marine organisms.
In addition, concentrations of carbonate ions are now lower than at any time during the last 800,000 years. The impacts on ocean biological diversity and ecosystem functioning will likely be severe, though the precise timing and distribution of these impacts are uncertain.
(See p. 58 of the report.)
Although millions of years ago CO2 levels were higher, today’s change is occurring rapidly, giving many marine organisms too little time to adapt. Some marine creatures are growing thinner shells or skeletons, for example. Some of these creatures play a crucial role in the food chain, and in ecosystem biodiversity.
Some species may benefit from the extra carbon dioxide, and a few years ago scientists and organizations, such as the European Project on OCean Acidification, formed to try to understand and assess the impacts further.
One example of recent findings is a tiny sand grain-sized plankton responsible for the sequestration of 25–50% of the carbon the oceans absorb is affected by increasing ocean acidification. This tiny plankton plays a major role in keeping atmospheric carbon dioxide (CO2) concentrations at much lower levels than they would be otherwise so large effects on them could be quite serious.
Other related problems reported by the Inter Press Service include more oceanic dead zones (areas where there is too little oxygen in the sea to support life) and the decline of important coastal plants and forests, such as mangrove forests that play an important role in carbon absorption. This is on top of the already declining ocean biodiversity that has been happening for a few decades, now.
Scientists now believe that ocean acidification is unparalleled in the last 300 million years, raising the possibility that we are entering an unknown territory of marine ecosystem change.
Increase in Pests and Disease
An increase in pests and disease is also feared.
A report in the journal Science in June 2002 described the alarming increase in the outbreaks and epidemics of diseases throughout the land and ocean based wildlife due to climate changes.
One of the authors points out that, Climate change is disrupting natural ecosystems in a way that is making life better for infectious diseases.
Failing Agricultural Output; Increase in World Hunger
The Guardian summarizes a United Nations warning that, One in six countries in the world face food shortages this year because of severe droughts that could become semi-permanent under climate change.
Drought and desertification are starting to spread and intensify in some parts of the world already.
Agriculture and livelihoods are already being affected
Failing agriculture in the future have long been predicted.
Looking to 2100, scientists who looked at projections of global warming’s impact on the average temperatures during the growing season fear that rising temperatures will have a significant impact upon crop yields, most noticeably in the tropics and sub tropics.
While warm weather can often be good for some crops, hotter than average temperatures for the entire season is often not good for plants.
This would affect at least half the world’s population that either live in the region or rely on food coming from that region.
IRIN (Integrated Regional Information Networks), part of the United Nations, has produced a series of short videos showing how some regions are already being affected by climate change and are trying to adapt as a result:
Changing crops
One example is farmers in Nepal finding that cultivating rice isn’t as productive as before, and are changing to other crops as a result:
Melting glaciers
In the Himalayas, melting glaciers means less water for local villages:
(South Asia in general is also seriously affected by rapidly retreating Himalayan glaciers which feed the mighty rivers that have created the various South Asian civilizations.)
Worsening floods
In Mozambique, rains are becoming heavier and causing floods, which affect crops and people’s livelihoods as they are displaced and have to change their way of life quickly.
It is feared that globally, there will be mass migrations in the future as climate change makes conditions worse in some regions of the world, and these challenges will play itself out on a much larger scale, with much more human movement. (And if Western attitudes towards immigration are negative now, they could be even worse in the future.)
Creeping deserts
In Mauritania, by contrast, there is the problem of increasing desertification, creeping ever closer to people who have had to change their way of life, focusing more on searching for water.
In some cases, improved agricultural techniques may help, such as rainwater harvesting and drip irrigation. Some also believe genetically modified crops may be essential to deal with changing climates. Yet, there are many other crucial issues that affect agriculture, such as poverty, political and economic causes of world hunger, global trade policies (which create unequal trade and affect the poorest countries the most), etc.
See IRIN’s videos on climate change impacts in Africa and Asia for more short clips.
Women face brunt of climate change impacts
It is recognized that poorer nations will suffer the worst from climate change, either because of geographical reasons, and/or because they will have less resources to cope with a problem (mostly caused by emissions from rich countries over the past decades).
In addition to poor countries, women are likely to suffer the worst, as the United Nations Population fund explains:
Women—particularly those in poor countries—will be affected differently than men. They are among the most vulnerable to climate change, partly because in many countries they make up the larger share of the agricultural work force and partly because they tend to have access to fewer income-earning opportunities. Women manage households and care for family members, which often limits their mobility and increases their vulnerability to sudden weather-related natural disasters. Drought and erratic rainfall force women to work harder to secure food, water and energy for their homes. Girls drop out of school to help their mothers with these tasks. This cycle of deprivation, poverty and inequality undermines the social capital needed to deal effectively with climate change.
The UNFPA also captures this in some videos that accompanied their 2009 report.
The first one is the above-described effects occurring in rural areas of Bolivia. The second one is on the impact on women in Vietnam.
Greenhouse gases and emissions resulting from human activity
Every few years, leading climate scientists at the UN’s Intergovernmental Panel on Climate Change (IPCC) have released major, definitive reports detailing the progress in understanding climate change. From the outset they have recommended that there be emission reductions. This body is comprised of hundreds of climate scientists around the world.
At the beginning of January 2007, the IPCC’s fourth major report summarized that they were even more certain than before of human-induced climate change because of better scientific understanding:
Global atmospheric concentrations of carbon dioxide, methane and nitrous oxide have increased markedly as a result of human activities since 1750 and now far exceed pre-industrial values determined from ice cores spanning many thousands of years. The global increases in carbon dioxide concentration are due primarily to fossil fuel use and land-use change, while those of methane and nitrous oxide are primarily due to agriculture.
… The understanding of anthropogenic warming and cooling influences on climate has improved since the Third Assessment Report (TAR), leading to very high confidence that the globally averaged net effect of human activities since 1750 has been one of warming.
Most of the observed increase in globally averaged temperatures since the mid-20th century is very likely due to the observed increase in anthropogenic greenhouse gas concentrations.
Their definition of very high confidence
and very likely
is a 90% chance of being correct. (Their 2001 report claimed a 66% certainty.)
This report was produced by some 600 authors from 40 countries. Over 620 expert reviewers and a large number of government reviewers also participated, according to the IPCC’s media advisory.
As Inter Press Service notes, although the IPCC has become the gold standard
for global scientific collaboration, their reports are inherently conservative:
The IPCC operates under the World Meteorological Organisation (WMO) and the United Nations Environment Programme (UNEP) and does not fund any research itself. It collects, evaluates and synthesises scientific data. Any U.N. country can be a member of the IPCC and can challenge the findings in its reports. And consensus is required for every word in the
Summary for Policy Makerssection included in each report.It’s an inherently conservative process, with oil-rich countries like Kuwait and Saudi Arabia always trying to tone down the conclusions and emphasise uncertainties and unknowns, said Weaver.
Differences in Greenhouse Gas Emission Around the World
As the World Resources Institute highlights there is a huge contrast between developed/industrialized nations and poorer developing countries in greenhouse emissions, as well as the reasons for those emissions. For example:
- In terms of historical emissions, industrialized countries account for roughly 80% of the carbon dioxide buildup in the atmosphere to date. Since 1950, the U.S. has emitted a cumulative total of roughly 50.7 billion tons of carbon, while China (4.6 times more populous) and India (3.5 times more populous) have emitted only 15.7 and 4.2 billion tons respectively (although their numbers will rise).
- Annually, more than 60 percent of global industrial carbon dioxide emissions originate in industrialized countries, where only about 20 percent of the world’s population resides.
- Much of the growth in emissions in developing countries results from the provision of basic human needs for growing populations, while emissions in industrialized countries contribute to growth in a standard of living that is already far above that of the average person worldwide. This is exemplified by the large contrasts in per capita carbons emissions between industrialized and developing countries. Per capita emissions of carbon in the U.S. are over 20 times higher than India, 12 times higher than Brazil and seven times higher than China.
At the 1997 Kyoto Conference, industrialized countries were committed to an overall reduction of emissions of greenhouse gases to 5.2% below 1990 levels for the period 2008—2012. (The Intergovernmental Panel on Climate Change (IPCC) said in its 1990 report that a 60% reduction in emissions was needed…)
The Economics of Ecosystems and Biodiversity (TEEB) is an organization — backed by the UN and various European governments — attempting to compile, build and make a compelling economics case for the conservation of ecosystems and biodiversity.
In a report titled The Economics of Ecosystems and Biodiversity for National and International Policy Makers 2009, TEEB noted different types of carbon emissions as colors of carbon
:
- Brown carbon
- Industrial emissions of greenhouse gases that affect the climate.
- Green carbon
- Carbon stored in terrestrial ecosystems e.g. plant biomass, soils, wetlands and pasture and increasingly recognized as a key item for negotiation in the UNFCCC.
- Blue carbon
- Carbon bound in the world’s oceans. An estimated 55% of all carbon in living organisms is stored in mangroves, marshes, sea grasses, coral reefs and macro-algae.
- Black carbon
- Formed through incomplete combustion of fuels and may be significantly reduced if clean burning technologies are employed.
But a mitigation approach needs to consider all these forms of carbon they note, not just one or two:
Past mitigation efforts concentrated on brown carbon, sometimes leading to land conversion for biofuel production which inadvertently increased emissions from green carbon. By halting the loss of green and blue carbon, the world could mitigate as much as 25% of total greenhouse gas (GHG) emissions with co-benefits for biodiversity, food security and livelihoods (IPCC 2007, Nellemann et al. 2009). This will only be possible if mitigation efforts accommodate all four carbon colors.
The United States is the World’s Largest Emitter of Greenhouse Gases Per Capita
Around 2007, China surpassed the US as the world’s largest emitter of greenhouse gases in terms of total output. Per person (per capita
), however, China’s emissions are much smaller.
Until recently, the United States was the world’s largest emitter of greenhouse gases. However, it remains the largest emitter when measured in terms of emissions per person.
Due to its much longer period of industrialization, the US has emitted far more into the atmosphere than China (greenhouse gases such as CO2 linger on in the atmosphere for decades).
In addition, the US:
- Accounts for roughly four percent of the world’s population;
- Accounts for approximately 20% of global emissions and some 40% of industrialized country emissions;
The previously 15-member European Union is also large Emitter
The previously 15 member-nations European Union (E.U.), if considered as a whole (for it is more comparable to the U.S.):
- Accounts for roughly 3 percent of the world’s population;
- Accounts for around 10% of global emissions and 24% of industrialized countries’ man-made emissions of the six main gases;
- Recent years have seen a reduction in emissions from those initial 15-member states. However,
- It is not near the level required;
- For the second consecutive year, in 2003, emissions from EU countries have actually increased slightly (though still remaining slightly lower than 1990 levels).
Stalling Kyoto Protocol Gets Push by Russia
The Kyoto Protocol was the climate change treaty negotiated in 1997, setting targets for emissions of greenhouse gases.
In order to be binding under international law, the treaty would need ratification from the countries responsible for around 55% of the global greenhouse gas emissions of 1990.
The U.S. being the world’s largest emitter of greenhouse gases, pulled out in 2001, leaving treaty ratification dependent on Russia, responsible for 17% of world emissions. Russia has to cut emission levels from the Soviet days, and their emissions in the past decade has been far less, so it should not pose as much of a problem to reduce such emissions.
Noting the above, the BBC commented on this adding that Kyoto was only ever a first step — now discussions on the next, more stringent, target on greenhouse gas emissions can begin.
Canada pulls out of Kyoto
On December 13 2011, Canada pulled out of the Kyoto climate treaty — which it is legally allowed to do — to condemnation domestically and internationally. One of the main concerns had been the cost to the tax payer: (CAN)$14bn.
Yet, the economic costs of inaction are in the trillions:
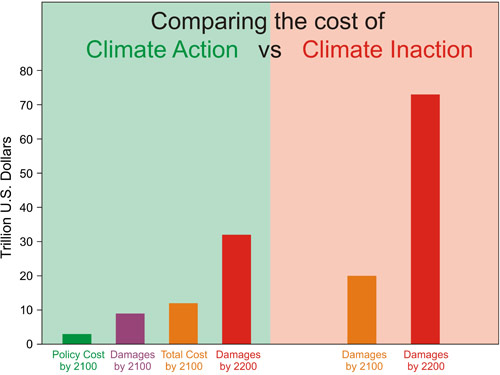
(Some believe one of Canada’s motivations to leave Kyoto was on its desire to protect the lucrative but highly polluting exploitation of tar sands, the second biggest oil reserve in the world
, as The Guardian had noted.)
Rich nation emissions have been rising
The UNFCCC reported (November 17, 2008) that although industrialized nations have reduced emissions between 1990 and 2006, in recent years, between 2000 and 2006, greenhouse gas emissions have generally increased by 2.3% .
This is despite an overall decrease of 4.7% since 1990. However, the more recent period suggests the rich country emission reductions are not sustainable. Furthermore, it looks worse considering a large part of this decrease is because of the collapse of the Soviet Union. As transition economies started to recover around 2000, emissions have started to rise.
Some nations with large reductions are also seeing limits, for example:
- UK (15.1% reduction) benefited by switching from coal to natural gas but that switch is largely in place now.
- Germany (18.2% reduction) has certainly invested in greenhouse gas emission reductions, but has been helped in large part because of reunification (East Germany, like much of eastern Europe and former Soviet states had economic problems, hence less emissions at the time).
- Other reductions have come in part from relocating manufacturing to other places such as China, which now claims at least one third of its emissions are because of production for others.
(See also this Climate Change Performance Index from German Watch and Climate Action Network Europe, which attempts to rank over 57 nations that account for 90% of the world’s total greenhouse gas emissions, including industrialized nations and emerging economies.)
Rich Nations Have Outsourced
Their Carbon Emissions
Global trade is an important feature of the modern world. The production and global distribution of manufactured products thus form a large portion of global human carbon emissions.
The Kyoto Protocol assigns carbon emissions to countries based on where production takes place rather than where things are consumed.
For many years, critics of the Kyoto Protocol have long argued that this means rich countries, who have outsourced much of their manufacturing to developing nations have an accounting trick they can use to show more emissions reduction than developing nations.
The BBC noted back in 2005 that this outsourcing was already taking place, but this idea started way before the Kyoto Protocol came into being.
In 1991 Larry Summers, then Chief Economist for the World Bank (and US Treasury Secretary, in the Clinton Administration, until George Bush and the Republican party came into power), had been a strong backer of structural adjustment policies. He wrote in an internal memo:
Just between you and me, shouldn’t the World Bank be encouraging more migration of dirty industries to the LDCs [less developed countries]?… The economic logic behind dumping a load of toxic waste in the lowest wage country is impeccable, and we should face up to that… Under-populated countries in Africa are vastly under-polluted; their air quality is probably vastly inefficiently low compared to Los Angeles or Mexico City… The concern over an agent that causes a one in a million change in the odds of prostate cancer is obviously going to be much higher in a country where people survive to get prostate cancer than in a country where under-five mortality is 200 per thousand.
Although the discussion above wasn’t about carbon emissions, the intention was the same: rather than directly address the problem, off-shoring dirty industries to the developing nations and let them deal with it.
More recently, The Guardian provided a useful summary of the impacts of this approach: carbon emissions cuts by developed countries since 1990 have been canceled out by increases in imported goods from developing countries — many times over.
They were summarizing global figures compiled and published in the Proceedings of the National Academy of Sciences of the US. And the findings seemed to vindicate what many environmental groups had said for many years about the Kyoto Protocol as noted earlier.
In more detail:
According to standard data, developed countries can claim to have reduced their collective emissions by almost 2% between 1990 and 2008. But once the carbon cost of imports have been added to each country, and exports subtracted – the true change has been an increase of 7%. If Russia and Ukraine – which cut their CO2 emissions rapidly in the 1990s due to economic collapse – are excluded, the rise is 12%.
…
Much of the increase in emissions in the developed world is due to the US, which promised a 7% cut under Kyoto but then did not to ratify the protocol. Emissions within its borders increased by 17% between 1990 and 2008 – and by 25% when imports and exports are factored in.
In the same period, UK emissions fell by 28 million tonnes, but when imports and exports are taken into account, the domestic footprint has risen by more than 100 million tonnes. Europe achieved a 6% cut in CO2 emissions, but when outsourcing is considered that is reduced to 1%.
…
The study shows a very different picture for countries that export more carbon-intensive goods than they import. China, whose growth has been driven by export-based industries, is usually described as the world's largest emitter of CO2, but its footprint drops by almost a fifth when its imports and exports are taken into account, putting it firmly behind the US. China alone accounts for a massive 75% of the developed world's offshored emissions, according to the paper.
In addition, as Climate News Network notes, Asian countries have been cutting emissions faster than Europe and the US. At the same time, there are signs of progress in Europe and the US, too. Germany for example is known to be pushing for renewables more than most. While recently the US has seen a drop in carbon emissions while seeing some economic growth.
Developing Countries Affected Most
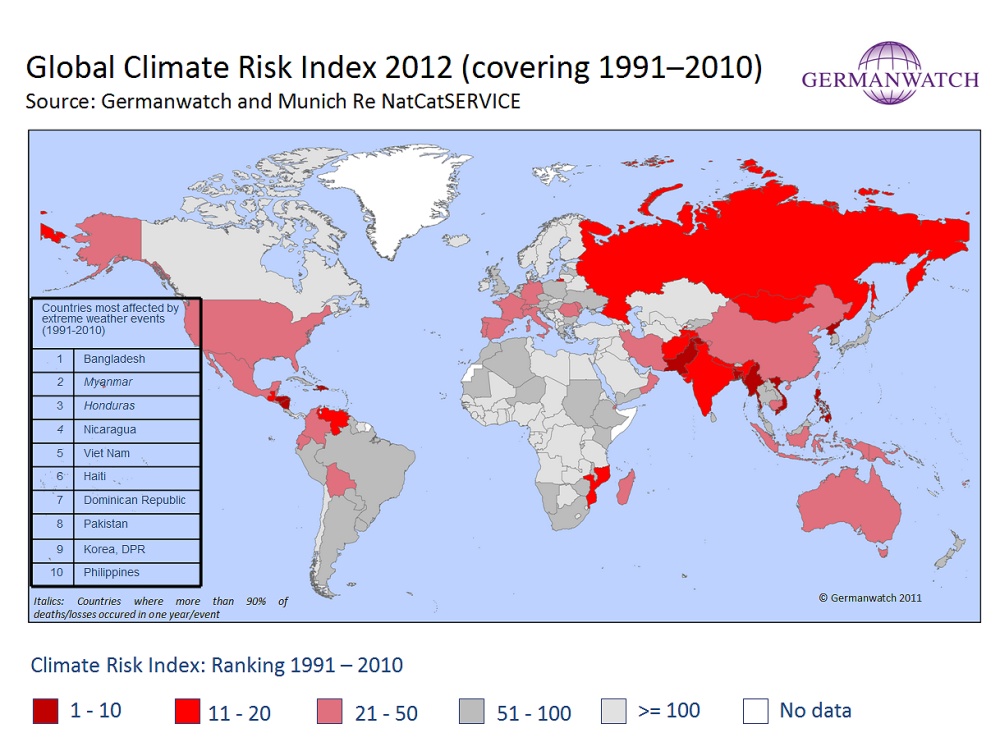
It has been known for some time know that developing countries will be affected the most. Reasons vary from lacking resources to cope, compared to developed nations, immense poverty, regions that many developing countries are in happen to be the ones where severe weather will hit the most, small island nations area already seeing sea level rising, and so on.
German Watch published a Global Climate Risk Index at the end of 2011 listing nations that would be affected the most from climate change based on extreme weather such as hurricanes and floods.
Between 1991 and 2010 they found these were the most affected nations:
- Bangladesh
- Myanmar
- Honduras
- Nicaragua
- Haiti
- Vietnam
- Dominican Republic
- Pakistan
- Korea, DPR
- Philippines
Much of Asia, as well as wealthier areas such as the US, Russia and Australia have also experienced specific incidents of very damaging extreme weather that the climate risk index captures:
Into 2013, November saw possibly the largest ever typhoon, Hiayan, make landfall and cause incredible devastation to parts of the Philippines with at least 10,000 feared dead and more than 9 million affected.
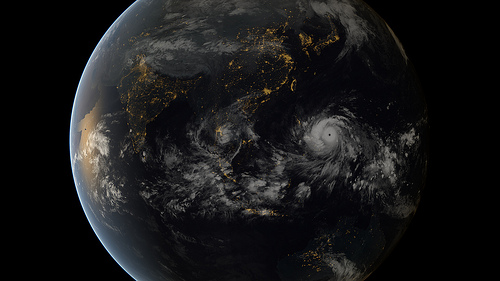
Hiayan struck just days before the start of a major UN conference on climate change perhaps acting as a wakeup call to the negotiators regarding potential impacts of inaction. While no single event can easily be attributed to climate change, as the Institute for Public Accuracy notes, this devastating typhoon demonstrates how the Global South pays the price for emissions historically from the North.
Greenhouse gas emissions continue to rise
The World Meteorological Organization (WMO) noted in November 2013 that the amount of greenhouse gases in the atmosphere reached a new record high in 2012, continuing an upward and accelerating trend which is driving climate change and will shape the future of our planet for hundreds and thousands of years.
Carbon dioxide, mainly from fossil fuel-related emissions, accounted for 80% of this increase. The atmospheric increase of CO2 from 2011 to 2012 was higher than its average growth rate over the past ten years.
(The International Energy Agency, IEA, also reported this earlier in the year.)
So despite increased global warming concerns and calls for action, little seems to have been achieved due to the political challenges, and skepticism that abounds.
Skepticism on Global Warming or That it can be human-induced
For a very long time, something of contention and debate in the U.S. had been whether or not a lot of climate change has in fact been induced by human activities, while many scientists around the world, Europe especially, have been more convinced that this is the case.
In May 2002, the Bush Administration in the U.S. did admit a link between human activities and climate change. However, at the same time the administration has continued its controversial stance of maintaining that it will not participate in the international treaty to limit global warming, the Kyoto Protocol, due to economic priorities and concerns. (More about the Kyoto Protocol, U.S. and others’ actions/inactions is discussed in subsequent pages on this section.)
Throughout the 1990s, especially in the United States, but in other countries as well, those who would try and raise the importance of this issue, and suggest that we are perhaps over-consuming, or unsustainably using our resources etc, were faced with a lot of criticism and ridicule. The previous link is to an article by George Monbiot, writing in 1999. In 2004, he notes a similar issue, whereby media attempts at balance has led to false balancing
where disproportionate time is given to more fringe scientists or those with less credibility or with additional agendas, without noting so, and thus gives the impression that there is more debate in the scientific community about whether or not climate change is an issue to be concerned about or not:
Picture a situation in which most of the media, despite the overwhelming weight of medical opinion, refused to accept that there was a connection between smoking and lung cancer. Imagine that every time new evidence emerged, they asked someone with no medical qualifications to write a piece dismissing the evidence and claiming that there was no consensus on the issue.
Imagine that the BBC, in the interests of
debate, wheeled out one of the tiny number of scientists who says that smoking and cancer aren’t linked, or that giving up isn’t worth the trouble, every time the issue of cancer was raised.Imagine that, as a result, next to nothing was done about the problem, to the delight of the tobacco industry and the detriment of millions of smokers. We would surely describe the newspapers and the BBC as grossly irresponsible.
Now stop imagining it, and take a look at what’s happening. The issue is not smoking, but climate change. The scientific consensus is just as robust, the misreporting just as widespread, the consequences even graver.
…
The scientific community has reached a consensus,the [U.K.] government’s chief scientific adviser, Professor David King, told the House of Lords last month.I do not believe that amongst the scientists there is a discussion as to whether global warming is due to anthropogenic effects.
It is man-made and it is essentially [caused by] fossil fuel burning, increased methane production… and so on.Sir David chose his words carefully. There is a discussion about whether global warming is due to anthropogenic (man-made) effects. But it is not—or is only seldom—taking place among scientists. It is taking place in the media, and it seems to consist of a competition to establish the outer reaches of imbecility.…
But these [skeptics and illogical points against climate change] are rather less dangerous than the BBC, and its insistence on
balancingits coverage of climate change. It appears to be incapable of running an item on the subject without inviting a sceptic to comment on it.Usually this is either someone from a corporate-funded thinktank (who is, of course, never introduced as such) or the professional anti-environmentalist Philip Stott. Professor Stott is a retired biogeographer. Like almost all the prominent sceptics he has never published a peer-reviewed paper on climate change. But he has made himself available to dismiss climatologists’ peer-reviewed work as the
liesof ecofundamentalists.This wouldn’t be so objectionable if the BBC made it clear that these people are not climatologists, and the overwhelming majority of qualified scientific opinion is against them. Instead, it leaves us with the impression that professional opinion is split down the middle. It’s a bit like continually bringing people on to the programme to suggest that there is no link between HIV and Aids.
What makes all this so dangerous is that it plays into the hands of corporate lobbyists. A recently leaked memo written by Frank Luntz, the US Republican and corporate strategist, warned that
The environment is probably the single issue on which Republicans in general—and President Bush in particular—are most vulnerable… Should the public come to believe that the scientific issues are settled, their views about global warming will change accordingly. Therefore, you need… to make the lack of scientific certainty a primary issue.
Monbiot’s comments above were over 5 years ago (as of writing), and yet some of those concerns, especially about false balancing, carry on today.
Gary Schmidt is a leading climate researcher working for NASA. He is also a contributor to RealClimate.org, a blog by climate scientists that attempt to dispel misinformation by climate skeptics and provide background information often missing in mainstream media. In one of his posts, he laments at the continual diversion caused by misinformation:
Recently there has been more of a sense that the issues being discussed (in the media or online) have a bit of a groundhog day quality to them. The same nonsense, the same logical fallacies, the same confusions – all seem to be endlessly repeated. The same strawmen are being constructed and demolished as if they were part of a make-work scheme for the building industry attached to the stimulus proposal.
However, (and perhaps belatedly) there is growing public acceptance of human-induced climate change as reports such as the US Global Change Research Program and the UK Met Office assert things like current climate change happening now and human-induced and that they will cause many problems.
But, as well as growing acceptance, there is also louder vocal opposition, and the repeated nonsense
and logical fallacies
that Schmidt was concerned about seems to have had an effect upon the general public — in the US, anyway; fewer Americans believe in global warming (as the Washington Post headlined it.
Amongst scientists, however, there is less skepticism: 11% of US scientists from any field disagree with human-induced climate change, while only 1% of US climatologists disagree, according to the following:

Asking who are among the 11% of skeptical scientists amongst all science fields, almost half are engineers.
For more detailed information, the following sites can be useful:
- Scienceblogs.com provides a summary of the various claims of climate change deniers
- grist.org provides a similar list as ScienceBlogs
- RealClimate.org is an authoritative blog maintained by some of the world’s leading climate scientists. They often attempt to explain very technical issues to lay people and often try to address common myths and other claims
- Skeptical Science is another blog that looks at various claims from skeptics and addresses them.
Bush Administration Accused of Silencing its own Climate Scientists
As revealed towards the end of January 2006, NASA’s top climate scientist said NASA and the Bush Administration tried to silence him.
While NASA said this was standard procedure to ensure an orderly flow of information, the scientist, Dr. James Hansen disagreed, saying that such procedures had already prevented the public from fully grasping recent findings about climate change that point to risks ahead.
Dr. Hansen, according to the New York Times reporting this, noted that these were fresh efforts
to silence him because he had said that significant emission cuts could be achieved with existing technologies, particularly in the case of motor vehicles, and that without leadership by the United States, climate change would eventually leave the earth a different planet.
(By contrast, the Bush administration’s policy is to use voluntary measures to slow, but not reverse, the growth of emissions.)
Furthermore, After that speech and the release of data by Dr. Hansen on Dec. 15 showing that 2005 was probably the warmest year in at least a century, officials at the headquarters of the space agency repeatedly phoned public affairs officers, who relayed the warning to Dr. Hansen that there would be
dire consequences
if such statements continued, those officers and Dr. Hansen said in interviews.
Earlier, in 2004, Dr. Hansen fell out of favor with the Bush Administration for publicly stating before the presidential elections that government scientists were being muzzled and that he planned to vote for John Kerry.
The New York Times also notes that this echoes other recent disputes, whereby many scientists who routinely took calls from reporters five years ago can now do so only if the interview is approved by administration officials in Washington, and then only if a public affairs officer is present or on the phone.
Furthermore, Where scientists’ points of view on climate policy align with those of the administration, however, there are few signs of restrictions on extracurricular lectures or writing.
And in terms of media manipulation, the Times also revealed that at least one interview (amongst many others) was canceled because it was with NPR, which the public affairs official responsible felt was the most liberal
media outlet in the country. This implies a political bias/propaganda in terms of how information is released to the public, which should be of serious concern.
At the beginning of June, 2006, the BBC Panorama documentary followed up on this and found that many scientists felt they were being censored and that various reports had been systematically suppressed, even altered. In one case, a major climate assessment report was due out a month before the 2004 presidential elections, but was delayed because it had such a bleak assessment, and the Bush administration did not want it to be part of the election issues. It was released shortly after the elections were over.
Panorama also interviewed a pollster who had advised the Bush Administration when they came into power in 2000 to question global warming, that humans caused it if it existed at all, to hire skeptical scientists, and play down its impacts. (The advisor has now distanced himself away from the Bush Administration’s stance today because he felt the science was more certain than it was in 2000.)
Just weeks before hurricane Katrina devastated parts of Southern United States, Panorama reported that Another scientist from the National Oceanic and Atmospheric Administration (NOAA) … had research which established global warming could increase the intensity of hurricanes. He was due to give an interview about his work but claims he was gagged.
After Katrina, the NOAA website said unusual hurricane activity is not related to global warming.
When a leading scientist was asked why NOAA came out with such a statement, he suggested it was ideologically driven.
(The BBC Panorama documentary is called Climate chaos: Bush’s climate of fear and as well as a summary, you can watch the actual documentary online.)
Despite attempts to discredit global warming concerns, the Bush Administration has now conceded that there is climate change and that humans are contributing to it, but Panorama reports that a lot of vital time has been lost, and that some scientists fear US policy may be too slow to carry out.
Almost a year after the story about attempts to silence NASA’s top climate scientist, many media outlets have reported on a new survey where hundreds of government scientists say they have perceived or personally experienced pressure from the Bush administration to eliminate phrases such as “climate change” and “global warming” from their reports and public statements. A US government hearing in the US is also pursuing this further as the seriousness of climate change is becoming more accepted.
There has been a similar concern in Australia. At the beginning of 2006, the Australian Broadcasting Company (ABC) revealed that some business lobby groups have influenced the Australian government to prevent Australia from reducing greenhouse gas emissions. This lobby group included interests from the coal, electricity, aluminum (aluminium), petroleum, minerals and cement industries. The documentary exposing this revealed possible corruption within government due to extremely close ties with such industries and lobby groups, and alleged silencing of government climate scientists.
In what would seem to be a twist to suppression of government reports, it was widely claimed that the US Environmental Protection Agency had suppressed
a report that was skeptical of climate change. However, it turns out that while the report was written by an employee on EPA time, but on his own initiative and not qualified to do so, and so couldn’t be published by the EPA and therefore was not suppressed. Furthermore, as the previous link finds, the report contained large pieces of plagiarism. In addition, the report was flawed as RealClimte.org quickly showed.
The headlines about this episode talked of suppression
and would likely increase the view amongst those still skeptical about climate change. Corrections to those headlines have been few, and less prominent, by comparison.
Many Sources Of Greenhouse Gases Being Discovered
Pollution from various industries, the burning of fossil fuels, methane from farm animals, forest destruction, rotting/dead vegetation etc have led to an increased number of greenhouse gases in the atmosphere. And, as international trade in its current form continues to expand with little regard for the environment, the transportation alone, of goods is thought to considerably contribute to global warming via emissions from planes, ships and other transportation vehicles. (For more about trade and globalization in its current form and how it affects the environment, as well as other consequences, visit this web site’s section on Trade, Economy, & Related Issues.)
Even sulphur emitted from ships are thought to contribute a fair bit to climate change. In fact, sulphur based gas, originating from industry, discovered in 2000 is thought to be the most potent greenhouse gas measured to date. It is called trifluoromethyl sulphur pentafluoride (SF5CF3).
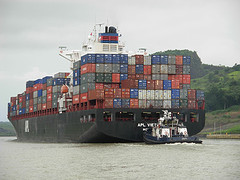
The Guardian adds that one giant container ship can emit almost the same amount of cancer and asthma-causing chemicals as 50 million cars.
Furthermore, Confidential data from maritime industry insiders based on engine size and the quality of fuel typically used by ships and cars shows that just 15 of the world's biggest ships may now emit as much pollution as all the world’s 760m cars. Low-grade ship bunker fuel (or fuel oil) has up to 2,000 times the sulphur content of diesel fuel used in US and European automobiles.
(Shipping is responsible for 3.5% to 4% of all climate change emissions the Guardian also notes.)
NewScientist.com reports (December 22, 2003) on a study that suggests soot particles may be worse than carbon dioxide in contributing to global warming. The soot particles also originate from industry, and during the industrial revolution, was quite common. While on the positive side there is less soot these days and perhaps easier to control if needed, alone, as one of the scientists of the study commented, It does not change the need to slow down the growth rate of carbon dioxide and eventually stabilize the atmospheric amount.
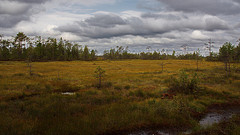
NewScientist.com and others have also reported (August 2005) that the world’s largest frozen peat bog is melting, and could unleash billions of tonnes of methane, a potent greenhouse gas, into the atmosphere. An area the size of France and Germany combined has been melting in the last 4 years. In addition, Western Siberia has warmed faster than almost anywhere else on the planet, with an increase in average temperatures of some 3°C in the last 40 years.
A scientist explained a fear that if the bogs dry out as they warm, the methane will oxidise and escape into the air as carbon dioxide. But if the bogs remain wet, as is the case in western Siberia today, then the methane will be released straight into the atmosphere. Methane is 20 times as potent a greenhouse gas as carbon dioxide.
Warming happening more quickly than predicted
While those denying climate change are reducing in number and there appears to be more effort to try and tackle the problem, climate scientists are now fearing that climate change is happening far faster and is having much larger impacts than they ever imagined.
The Arctic plays an incredibly important role in the balance of the earth’s climate. Rapid changes to it can have knock-on effects to the rest of the planet. Some have described the Arctic as the canary in the coal mine, referring to how canary birds used to be taken deep down coal mines. If they died, it implied oxygen levels were low and signaled mine workers to get out.
Satellite observations show the arctic sea ice decreasing, and projections for the rest of the century predict even more shrinkage:
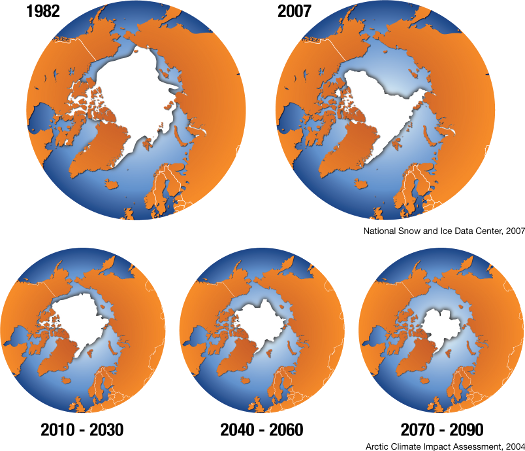
In terms of biodiversity, the prospect of ice-free summers in the Arctic Ocean implies the loss of an entire biome
, the Global Biodiversity Outlook report notes (p. 57).
In addition, Whole species assemblages are adapted to life on top of or under ice — from the algae that grow on the underside of multi-year ice, forming up to 25% of the Arctic Ocean’s primary production, to the invertebrates, birds, fish and marine mammals further up the food chain.
The iconic polar bear at the top of that food chain is therefore not the only species at risk even though it may get more media attention.
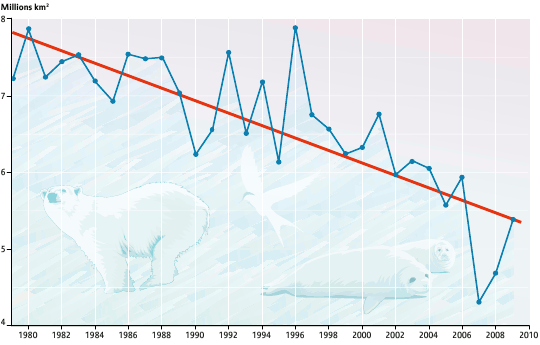
Note, the ice in the Arctic does thaw and refreeze each year, but it is that pattern which has changed a lot in recent years as shown by this graph:
It is also important to note that loss of sea ice has implications on biodiversity beyond the Arctic, as the Global Biodiversity Outlook report also summarizes:
- Bright white ice reflects sunlight.
- When it is replaced by darker water, the ocean and the air heat much faster, a feedback that accelerates ice melt and heating of surface air inland, with resultant loss of tundra.
- Less sea ice leads to changes in seawater temperature and salinity, leading to changes in primary productivity and species composition of plankton and fish, as well as large-scale changes in ocean circulation, affecting biodiversity well beyond the Arctic.
Some scientists fear changes are happening to the Arctic much faster than anticipated. The previous link mentions that despite computer climate models predicting loss of Arctic sea ice by 2050 to 2080, some scientists fear it could be as soon as 2015. The BBC notes similar concerns by scientists, with one quoted as saying the sea ice is so thin that you would have to have an exceptional sequence of cold winters and cold summers in order for it to rebuild.
Another BBC article reports scientists now have unambiguous evidence that the warming in the Arctic is accelerating.
The Arctic reflects much sunlight back into space helping keep earth temperate. More melting will result in less reflection and even more heat being absorbed by the earth. A chain reaction could result, such as the Greenland ice sheet melting (which will actually increase sea levels, whereas the melting of Arctic ice will not because it is sea ice), possibly increasing the melting of permafrost in Siberia, which will release huge amounts of methane (as noted above), and rapidly change climate patterns, circulation patterns and jet streams, far quicker than what most of the environment could adapt to easily.
Older members of the indigenous Inuit people describe how weather patterns have shifted and changed in recent years, while they also face challenges to their way of life in the form of increased commercial interest in the arctic region. This combination of environmental and economic factors put indigenous populations ways at a cross roads as this documentary from explore.org shows:
For decades, scientists and environmentalists have warned that the way we are using Earth’s resources is not sustainable. Alternative technologies have been called for repeatedly, seemingly upon deaf ears (or, cynically, upon those who don’t want to make substantial changes as it challenges their bottom line and takes away from their current profits).
In the past, some companies and industries have pushed back on environmental programs in order to increase profits or to survive in a tough business world.
It has perhaps taken about a decade or so — and a severe enough global financial crisis that has hit the heart of this way of thinking — to change this mentality (in which time, more greenhouse gases have been emitted — inefficiently). Is that too late or will it be okay?
Economists talk of the price signal that is fundamental to capitalism; the ability for prices to indicate when a resource is becoming scarcer. At such a time, capitalism and the markets will mobilize automatically to address this by looking for ways to bring down costs. As a result, resources are supposedly infinite. For example, if energy costs go up, businesses will look for a way to minimize such costs for themselves, and it is in such a time that alternatives come about and/or existing resources last longer because they are used more efficiently. Running out of resources
should therefore be averted.
However, it has long been argued that prices don’t truly reflect the full cost of things, so either the signal is incorrect, or comes too late. The price signal also implies the poorest often pay the heaviest costs. For example, commercially over-fishing a region may mean fish from that area becomes harder to catch and more expensive, possibly allowing that ecosystem time to recover (though that is not guaranteed, either). However, while commercial entities can exploit resources elsewhere, local fishermen will go out of business and the poorer will likely go hungry (as also detailed on this site’s section on biodiversity). This then has an impact on various local social, political and economic issues.
In addition to that, other related measurements, such as GNP are therefore flawed, and even reward unproductive or inefficient behavior (e.g. Efficiently
producing unhealthy food — and the unhealthy consumer culture to go with it — may profit the food industry and a private health sector that has to deal with it, all of which require more use of resources. More examples are discussed on this site’s section on consumption and consumerism).
Our continued inefficient pumping of greenhouse gases into the environment without factoring the enormous cost as the climate already begins to change is perhaps an example where price signals may come too late, or at a time when there is already significant impact to many people. Resources that could be available more indefinitely, become finite because of our inability or unwillingness to change.
The subsequent pages on this site look at the political issues around tackling climate change.
Author and Page Information
- Created:
- Last updated: